Plotting function for diet comparison summary
Source:R/pretty_results.R
plot_diet_comparison_gram.RdPlotting function for diet comparison summary
Arguments
- plot_obj
an object of class <diet_comparison_percent>
- title_text
Title for the plot
- axis_x_text
X axis title
- axis_y_text
Y axis title
Examples
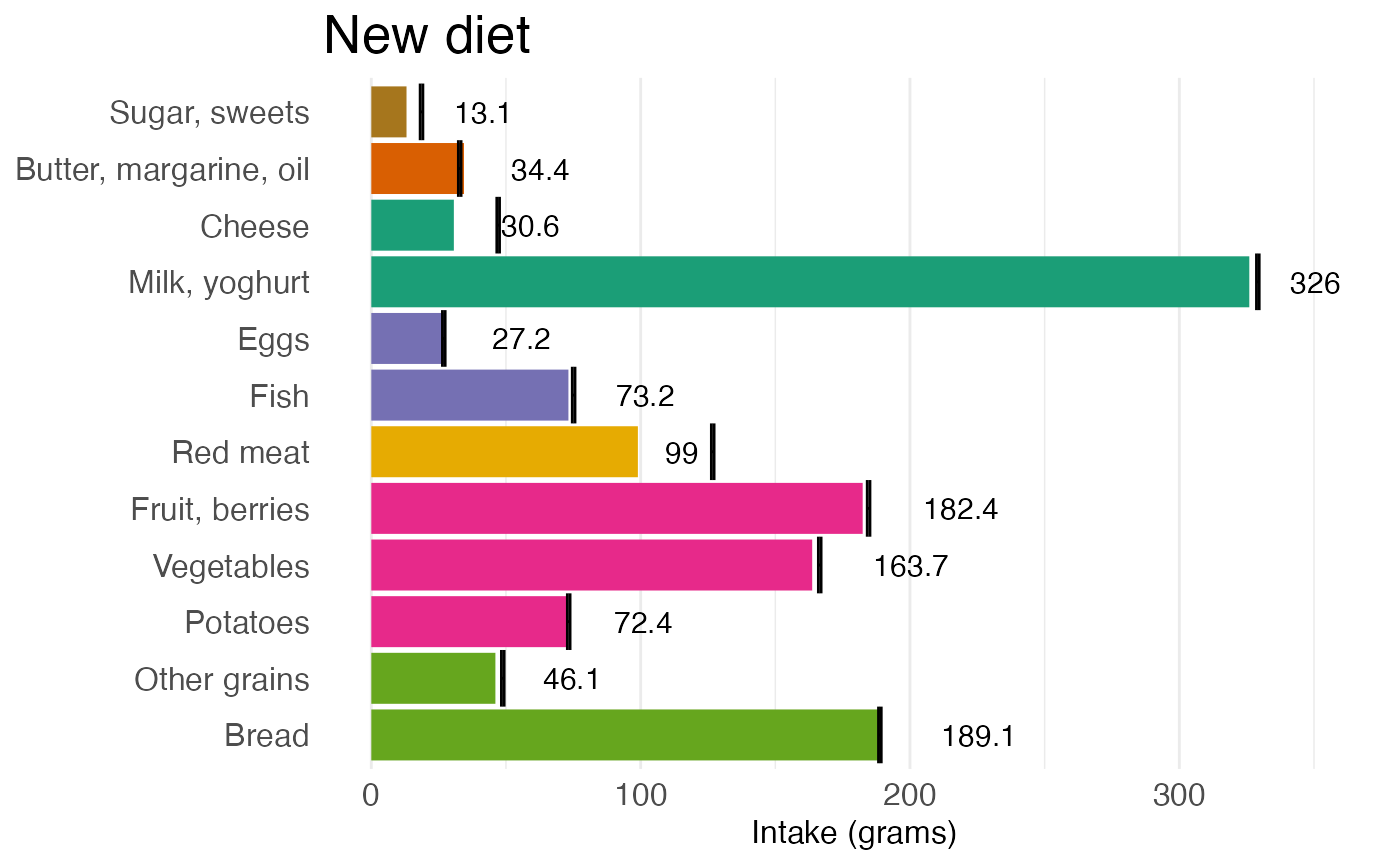
ddd <- prep_diet_comparison_gram(data_dietsummary = data_newdiet)
plot_diet_comparison_gram(plot_obj = ddd,
                          title_text = 'New diet',
                         axis_x_text = 'Food groups',
                          axis_y_text = 'Intake (grams)')